TL;DR
- Urban mining, the recovery of critical minerals from end-of-life equipment, has become a strategic supply chain function in 2026, not just a recycling nice-to-have. The UN counted 91 billion dollars of metals embedded in a single year of global e-waste.
- High-grade circuit boards carry 150 to 400 grams of gold per tonne, compared with 1 to 5 grams per tonne at a typical gold mine. Your surplus stream is richer ore than most mines will ever touch.
- Policy is pulling demand forward: the EU Critical Raw Materials Act requires 25% of strategic raw material consumption to come from recycling by 2030, and the US has committed over 1.25 billion dollars to domestic rare earth magnet capacity that needs recycled feedstock.
- Copper’s record 2026 prices, driven by AI data center and grid demand, mean the timing for monetizing copper-bearing surplus has rarely been better.
- Investment recovery teams already control the feedstock. The six-step framework in this guide turns retired assets into documented critical mineral streams that satisfy both the CFO and the sustainability report.
What Is Urban Mining and Why It Matters for Investment Recovery in 2026
Urban mining is the practice of recovering valuable metals and critical minerals from products, buildings, and equipment that have reached end of life, rather than extracting virgin material from the ground. For investment recovery professionals, urban mining is not a new discipline so much as a new lens on work they already do: the servers, motors, transformers, batteries, and process equipment sitting in your surplus inventory are, quite literally, ore. The difference in 2026 is that governments, manufacturers, and commodity markets have all started treating that ore as strategically important, and they are paying accordingly.
Urban mining defined: the surplus asset connection
Traditional mining digs rock; urban mining harvests the built environment. The World Economic Forum describes it as tapping the “above-ground mine” of discarded electronics and infrastructure. In corporate practice, that above-ground mine is managed by exactly one function: the investment recovery team. If you are new to the discipline, our guide on what investment recovery is and how it works covers the foundation. Urban mining simply extends the familiar reuse-resale-recycle hierarchy one level deeper, into the elemental value of the assets themselves.
Why 2026 is the inflection point for critical mineral recovery
Three forces converged over the past 18 months. First, geopolitics: export controls on rare earth elements and processing concentration in a small number of countries pushed Western governments to fund domestic recovery at unprecedented scale. Second, demand: AI data center construction is consuming copper, and the motors and magnets in electrified equipment depend on neodymium, praseodymium, and dysprosium. Third, regulation: the EU Critical Raw Materials Act put hard numbers on recycled content, and US federal money is now flowing into magnet and mineral recycling capacity. The International Energy Agency estimates that scaled recycling could reduce the need for new mining activity by 5 to 30% by 2040, with the market value of recycled energy transition minerals reaching roughly 200 billion dollars by 2050.
The numbers: e-waste as the richest ore body on earth
The UN’s Global E-waste Monitor 2024 documented 62 million tonnes of e-waste generated in a single year, containing an estimated 91 billion dollars in embedded metals: 19 billion dollars of copper, 15 billion dollars of gold, and 16 billion dollars of iron among them. Only 22.3% of that mass was formally collected and recycled. The rest leaked into landfills, informal channels, and storage rooms. Roughly 28 billion dollars of secondary raw materials were reclaimed through urban mining that year, which means the majority of the value is still being left on the table. E-waste generation is on track to hit 82 million tonnes by 2030.
Value of metals embedded in one year of global e-waste, per the UN Global E-waste Monitor 2024. Less than a quarter was formally recovered.
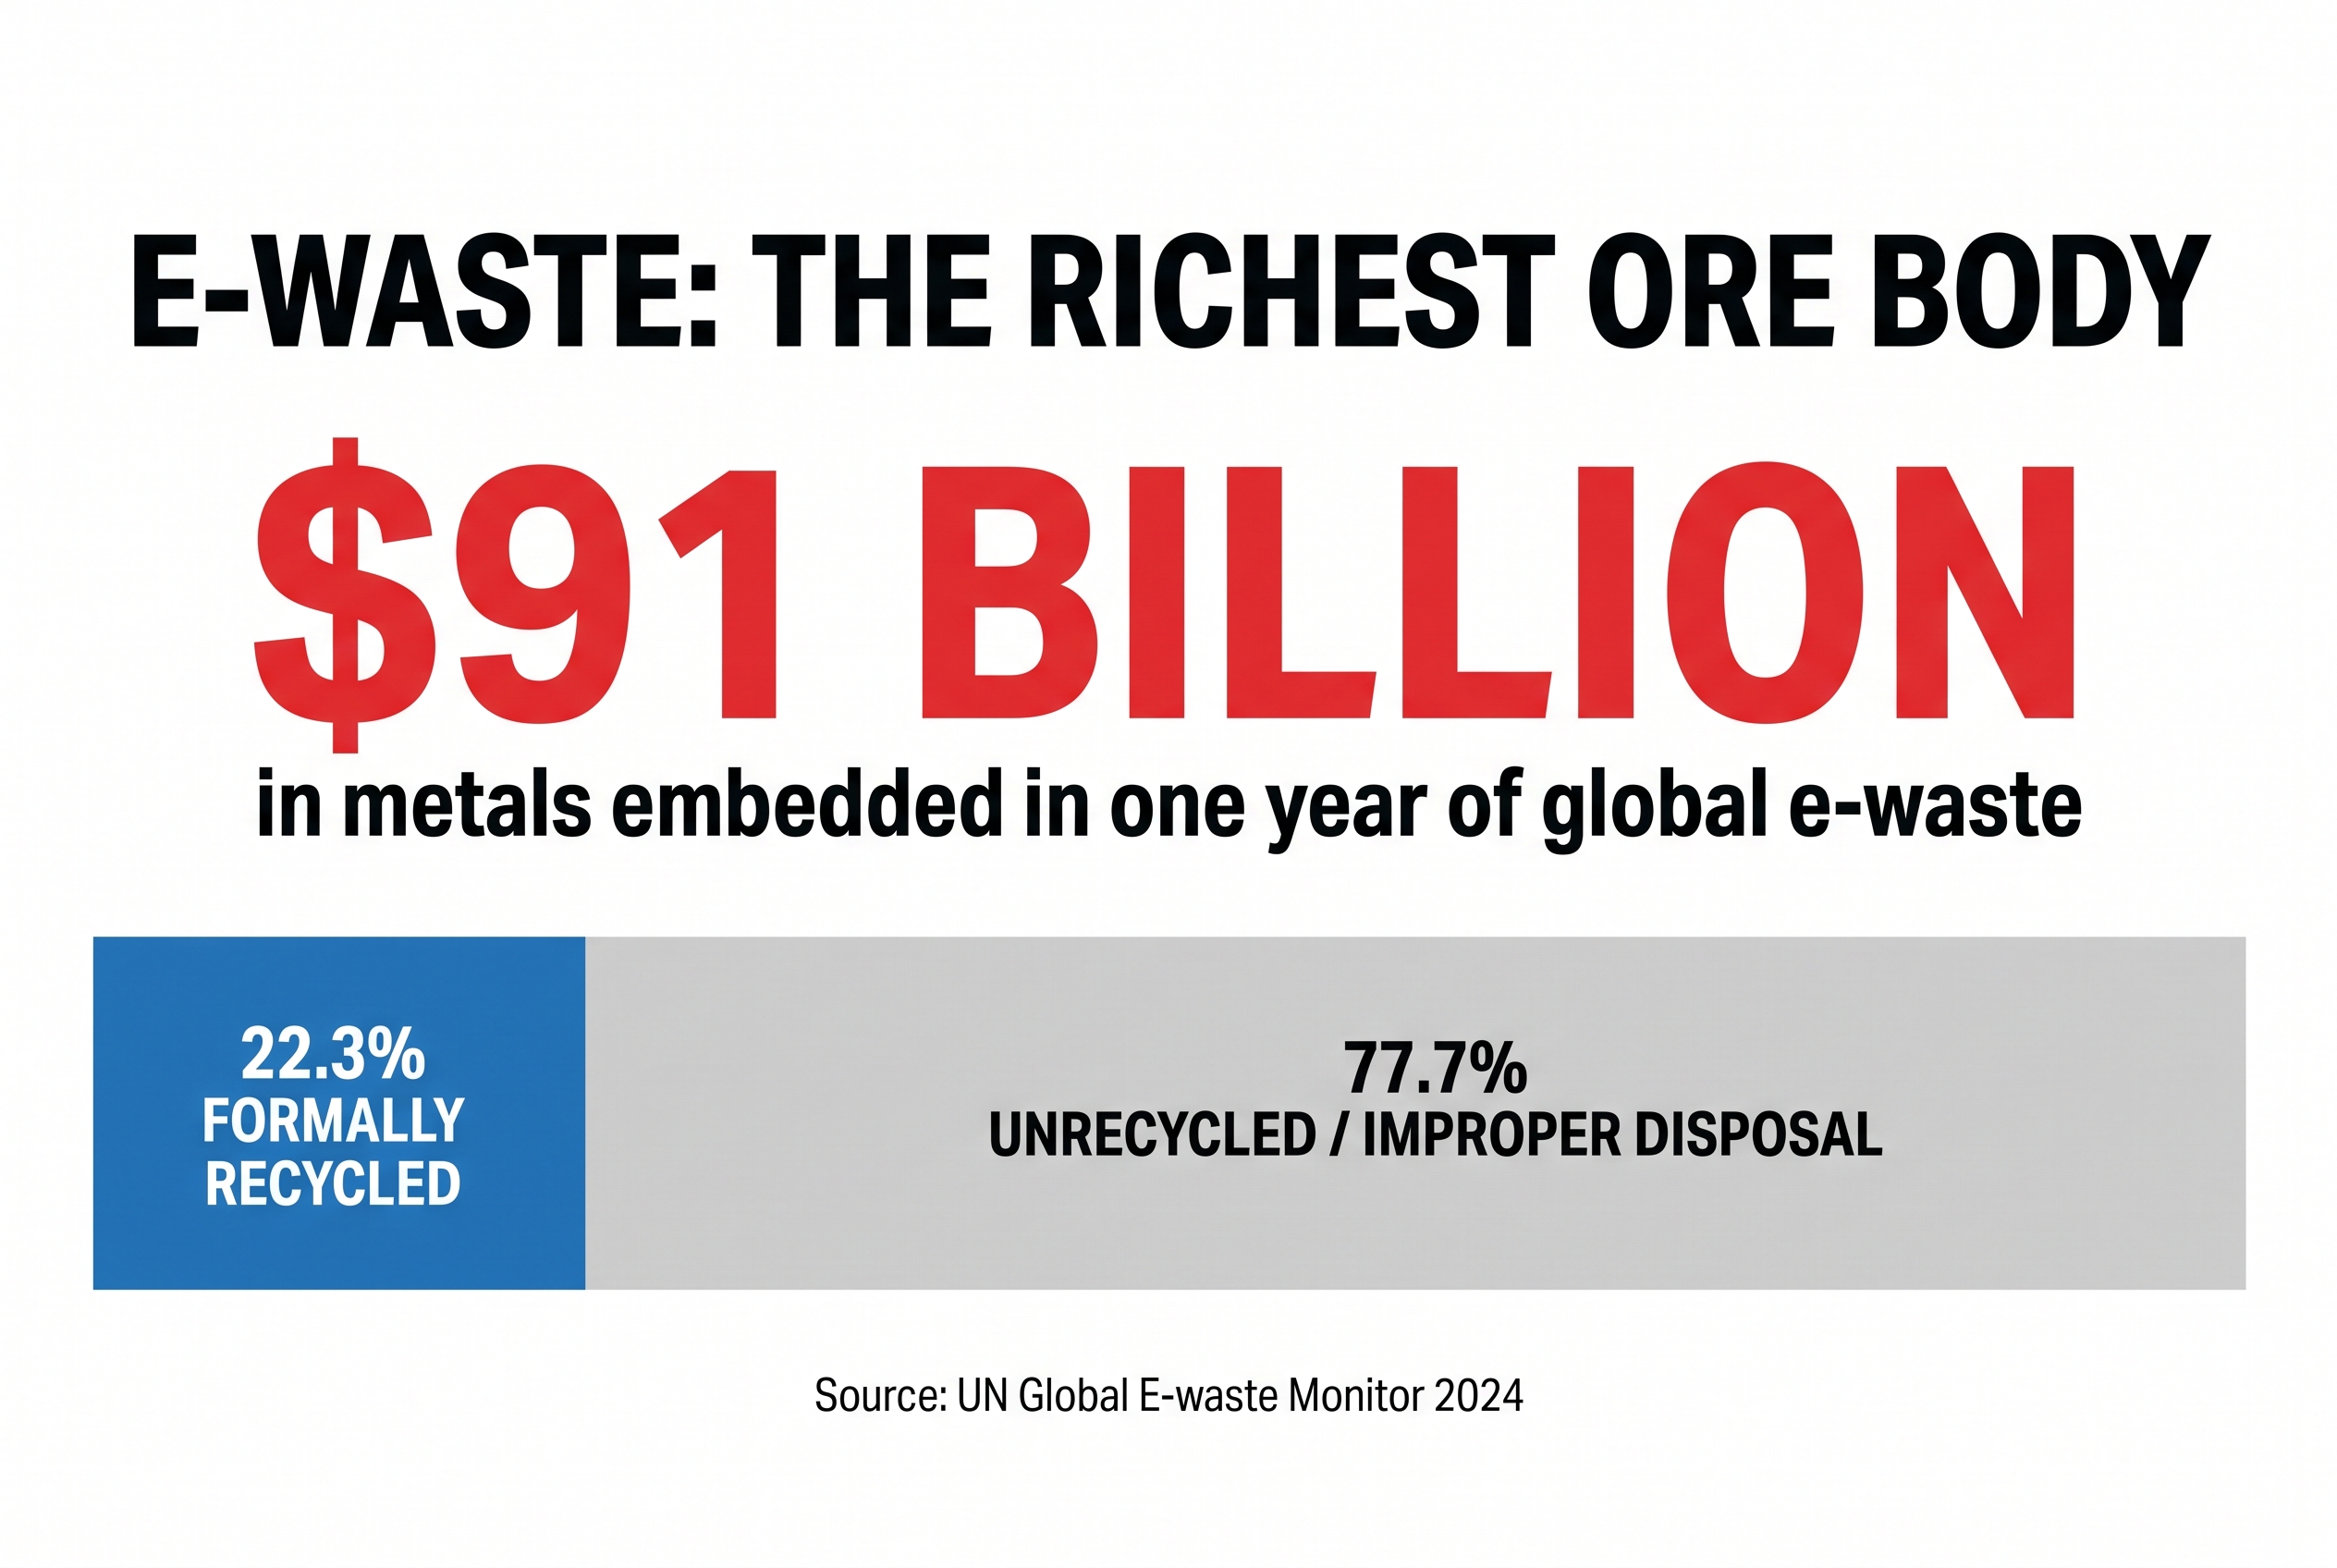
E-waste value in 2026: $91 billion of metals embedded in a single year, only 22.3% formally recovered.
The Critical Minerals Inside Your Surplus Assets
Most corporate asset registers describe equipment by function: pump, server, forklift, switchgear. A critical minerals audit describes the same register by element, and the difference in perceived value can be dramatic. Here is where the money concentrates.
Rare earth magnets: motors, drives, and hard disk drives
Neodymium-iron-boron (NdFeB) permanent magnets are the single most strategically sensitive material stream in most surplus inventories. They sit inside hard disk drives, electric motors, wind turbine generators, MRI equipment, and industrial servo drives. Recyclers using hydrogen-based processing can now recover magnet material at 90%-plus recovery rates without acid-intensive chemistry, and US processing capacity is expanding fast on the back of defense funding. Data center operators retiring storage fleets are particularly well positioned; a single decommissioning wave can yield tonnes of magnet-bearing drives. Our data center decommissioning checklist and our analysis of why AI is accelerating data center refresh cycles both intersect directly with this stream.
Copper, gold, and platinum group metals (PGMs): where the money concentrates
Gold concentration in high-grade printed circuit boards runs 150 to 400 grams per tonne, and sorted server boards can go higher. A productive traditional gold mine processes ore at 1 to 5 grams per tonne. Mixed e-waste is, on average, around 60 times richer in gold than natural ore. Copper is the volume play: wiring harnesses, busbars, windings, transformers, and switchgear all carry it, and 2026 spot prices set records above 13,000 dollars per tonne early in the year. Platinum group metals concentrate in catalysts, lab equipment, and certain sensors. For the broader market context, see our scrap metal market briefing for investment recovery professionals.
Battery metals: lithium, cobalt, and nickel in retired systems
Lithium-ion batteries from EV fleets, backup power systems, and material handling equipment carry lithium, cobalt, nickel, and manganese. The IEA projects secondary supply could meet up to 12% of cobalt demand by 2040. Recovery economics depend heavily on chemistry and state of health, which is why second-life assessment comes before shredding. We cover the decision tree in depth in our EV battery recycling playbook and our BESS decommissioning guide.
| Surplus asset class | Primary critical minerals | 2026 demand driver |
|---|---|---|
| Servers, storage, network gear | Gold, copper, palladium, NdFeB magnets | AI refresh cycles, magnet feedstock programs |
| Electric motors and drives | Copper windings, rare earth magnets, steel | Motor efficiency retrofits, magnet recycling capacity |
| Transformers and switchgear | Copper, aluminum, electrical steel | Grid expansion, record copper prices |
| Batteries (EV, BESS, UPS, forklift) | Lithium, cobalt, nickel, copper | Battery gigafactory feedstock, CRMA recycled content |
| Catalysts and lab equipment | Platinum, palladium, rhodium | PGM supply tightness, refiner competition |
Policy Tailwinds: CRMA, DOD Magnet Investments, and Domestic Supply Chains
The EU Critical Raw Materials Act recycling benchmarks
The EU Critical Raw Materials Act sets three 2030 benchmarks for strategic raw materials: 10% of annual consumption from domestic extraction, 40% from domestic processing, and 25% from domestic recycling. That last number is the one that matters for surplus asset holders, because the current end-of-life recycling input rate across critical raw materials averages roughly 8.3%. Tripling it by 2030 requires feedstock, and feedstock means corporate end-of-life equipment. The Act also introduces recyclability and recycled-content requirements for permanent magnets, which directly raises the value of documented, segregated magnet streams.
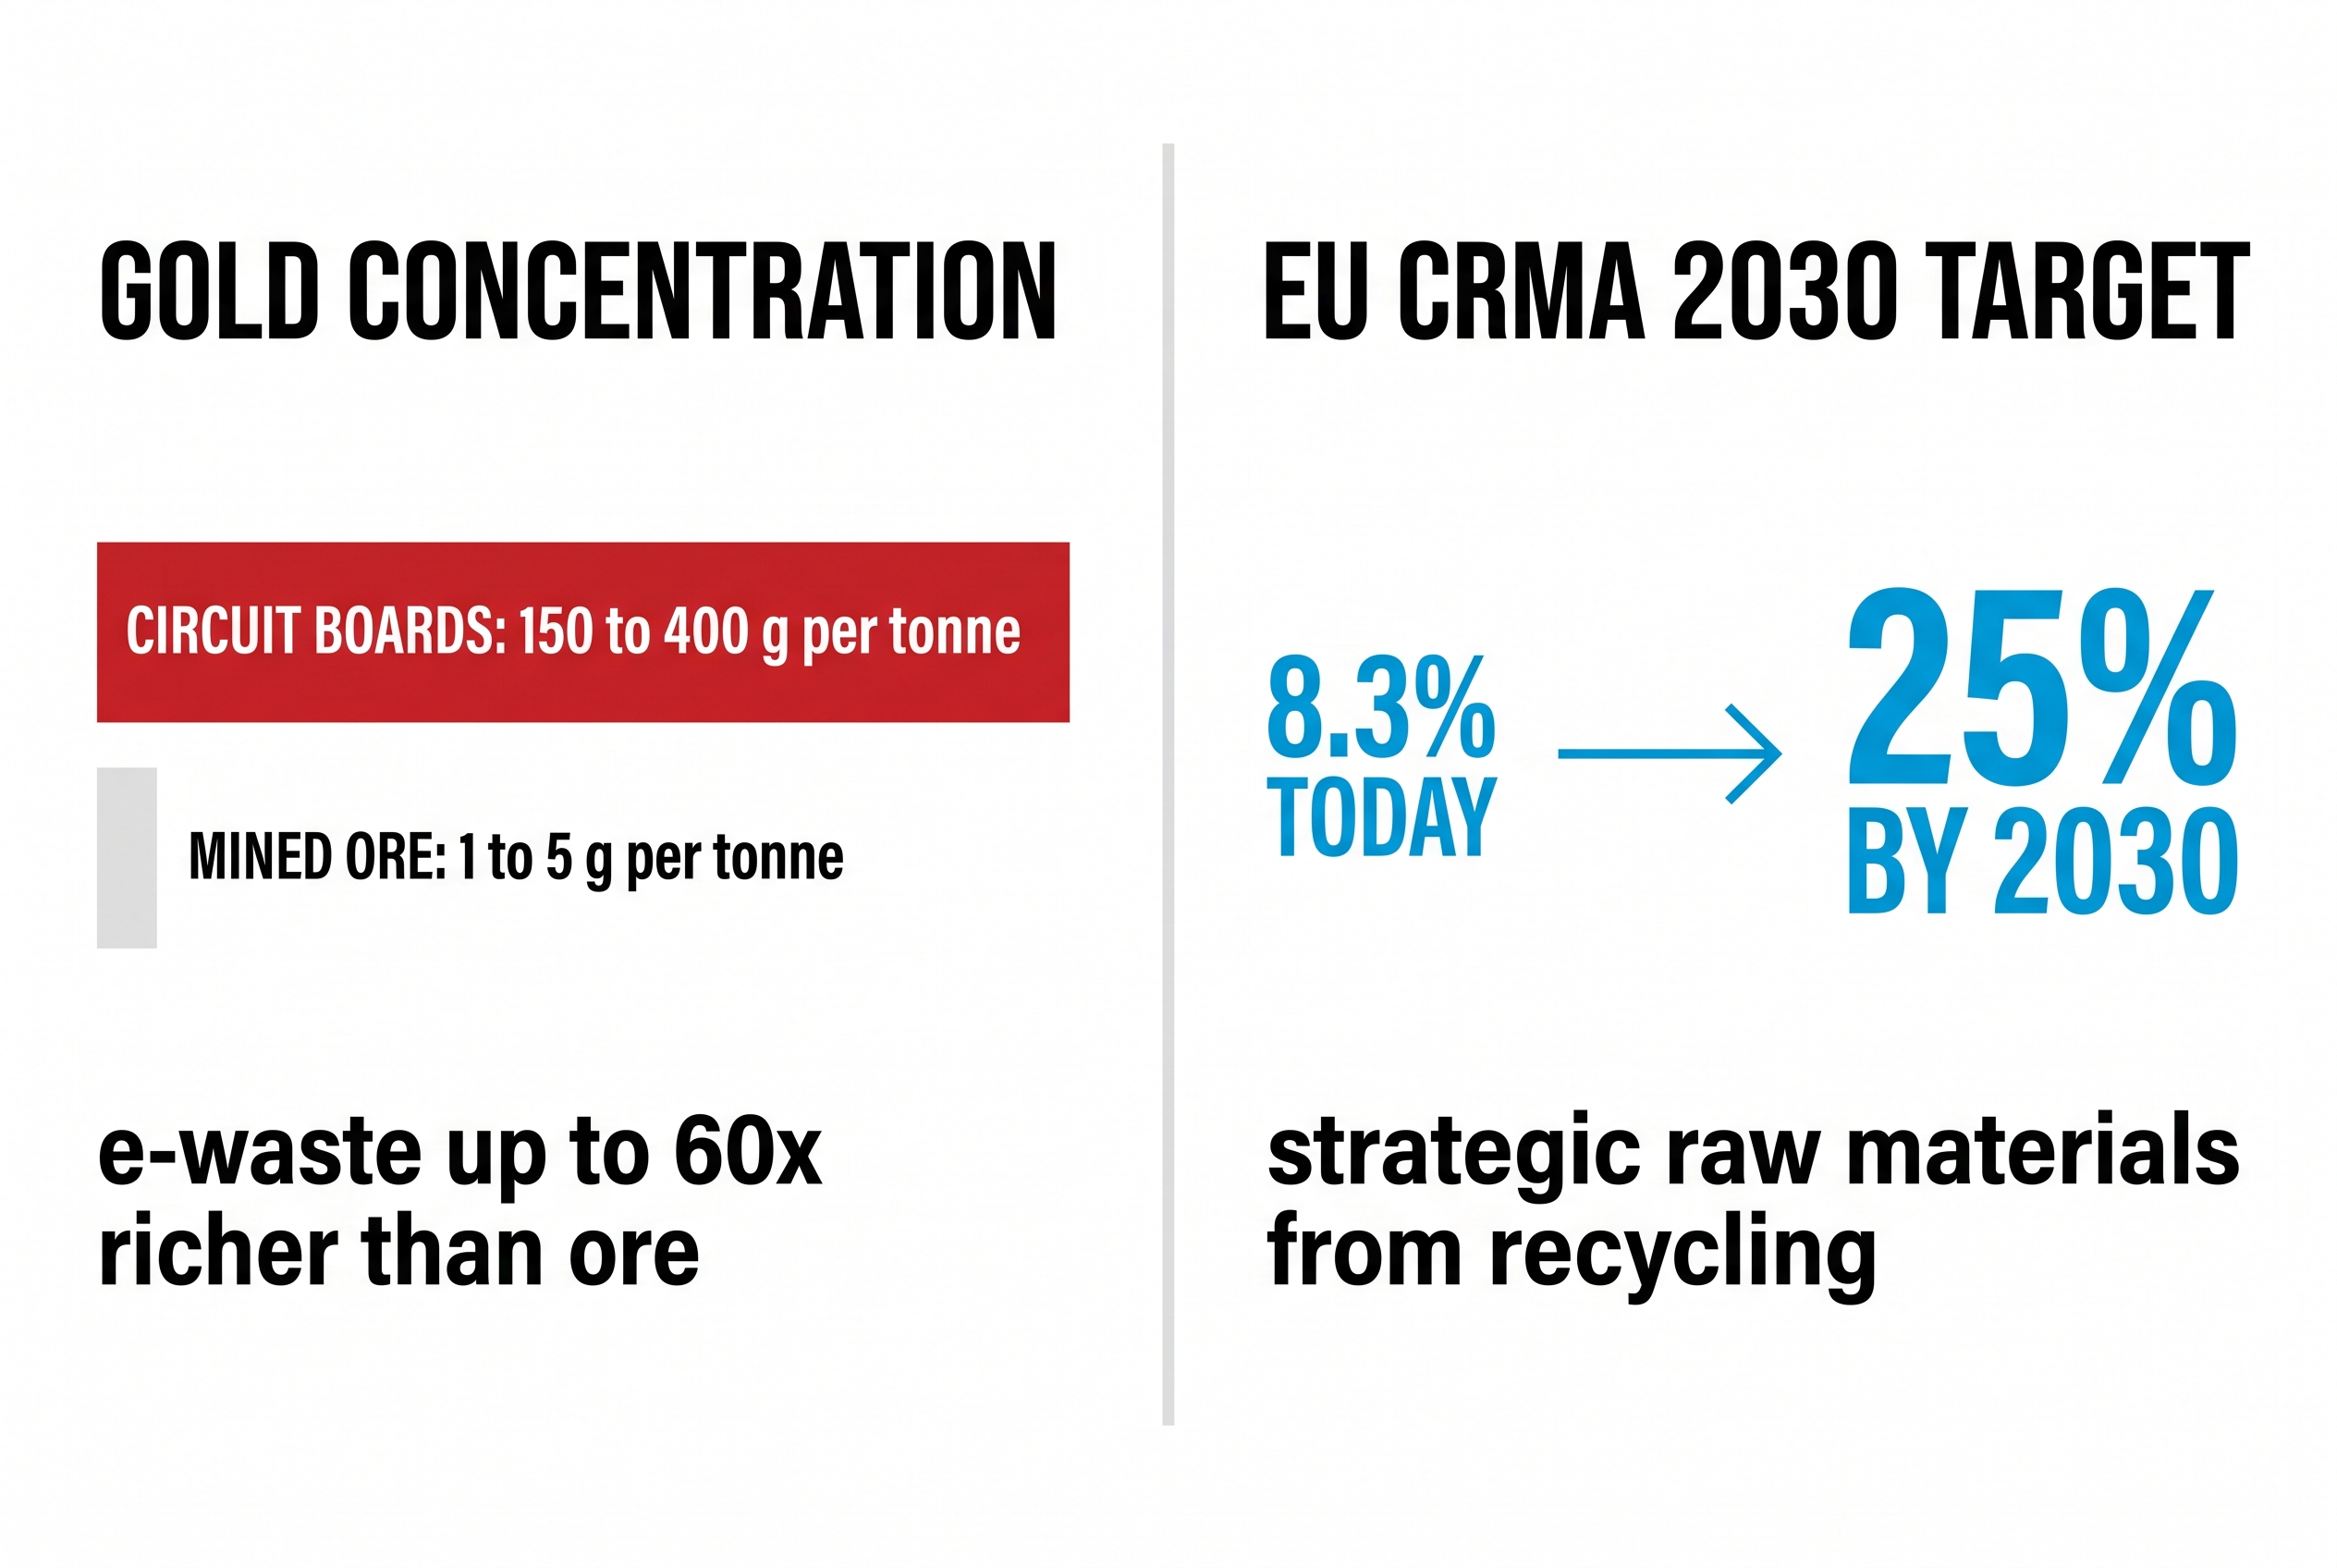
Richer than ore, and policy is pulling demand: circuit boards run up to 60x richer in gold, and the CRMA targets 25% recycled content by 2030, up from 8.3% today.
US mine-to-magnet buildout and what it means for feedstock
In the United States, the Department of Defense partnership with MP Materials anchors a 1.25 billion dollar “10X” magnet manufacturing campus in Texas, with a 10-year NdPr price floor of 110 dollars per kilogram and a full offtake commitment. Apple invested 500 million dollars in a dedicated recycling line to feed recycled magnet material into its devices. The Department of Energy is funding a Critical Minerals and Materials Accelerator to prototype recovery of rare earths from scrap, and Oak Ridge National Laboratory technologies are being licensed for spent magnet recycling facilities. The signal for investment recovery teams is unambiguous: domestic buyers for magnet-bearing scrap now exist at industrial scale, they are contractually hungry for feedstock, and pricing floors reduce the volatility that historically made these streams marginal.
How policy translates into buyer demand for surplus
Recycled-content mandates work backwards through the supply chain. When a magnet maker must prove recycled input, it pays a premium for verified, documented scrap. When a European OEM must hit CRMA-aligned targets, its procurement team starts asking asset disposition vendors for chain-of-custody paperwork. Tariff dynamics amplify the effect by making domestic secondary material more attractive than imported primary material, a shift we analyzed in how tariffs are reshaping surplus asset management. Documentation, always good practice, is now a price lever.
Key distinction: Urban mining value is not just the commodity price of the recovered metal. It increasingly includes a verification premium: buyers pay more for streams with documented origin, mass balance, and certified processing, because that documentation is what lets them claim recycled content under CRMA and similar rules.
Building an Urban Mining Program: A Step-by-Step Framework
An urban mining program is an overlay on your existing investment recovery process, not a replacement for it. The reuse hierarchy still rules: redeploy first, resell second, recover materials third. What changes is the rigor applied to the third tier.
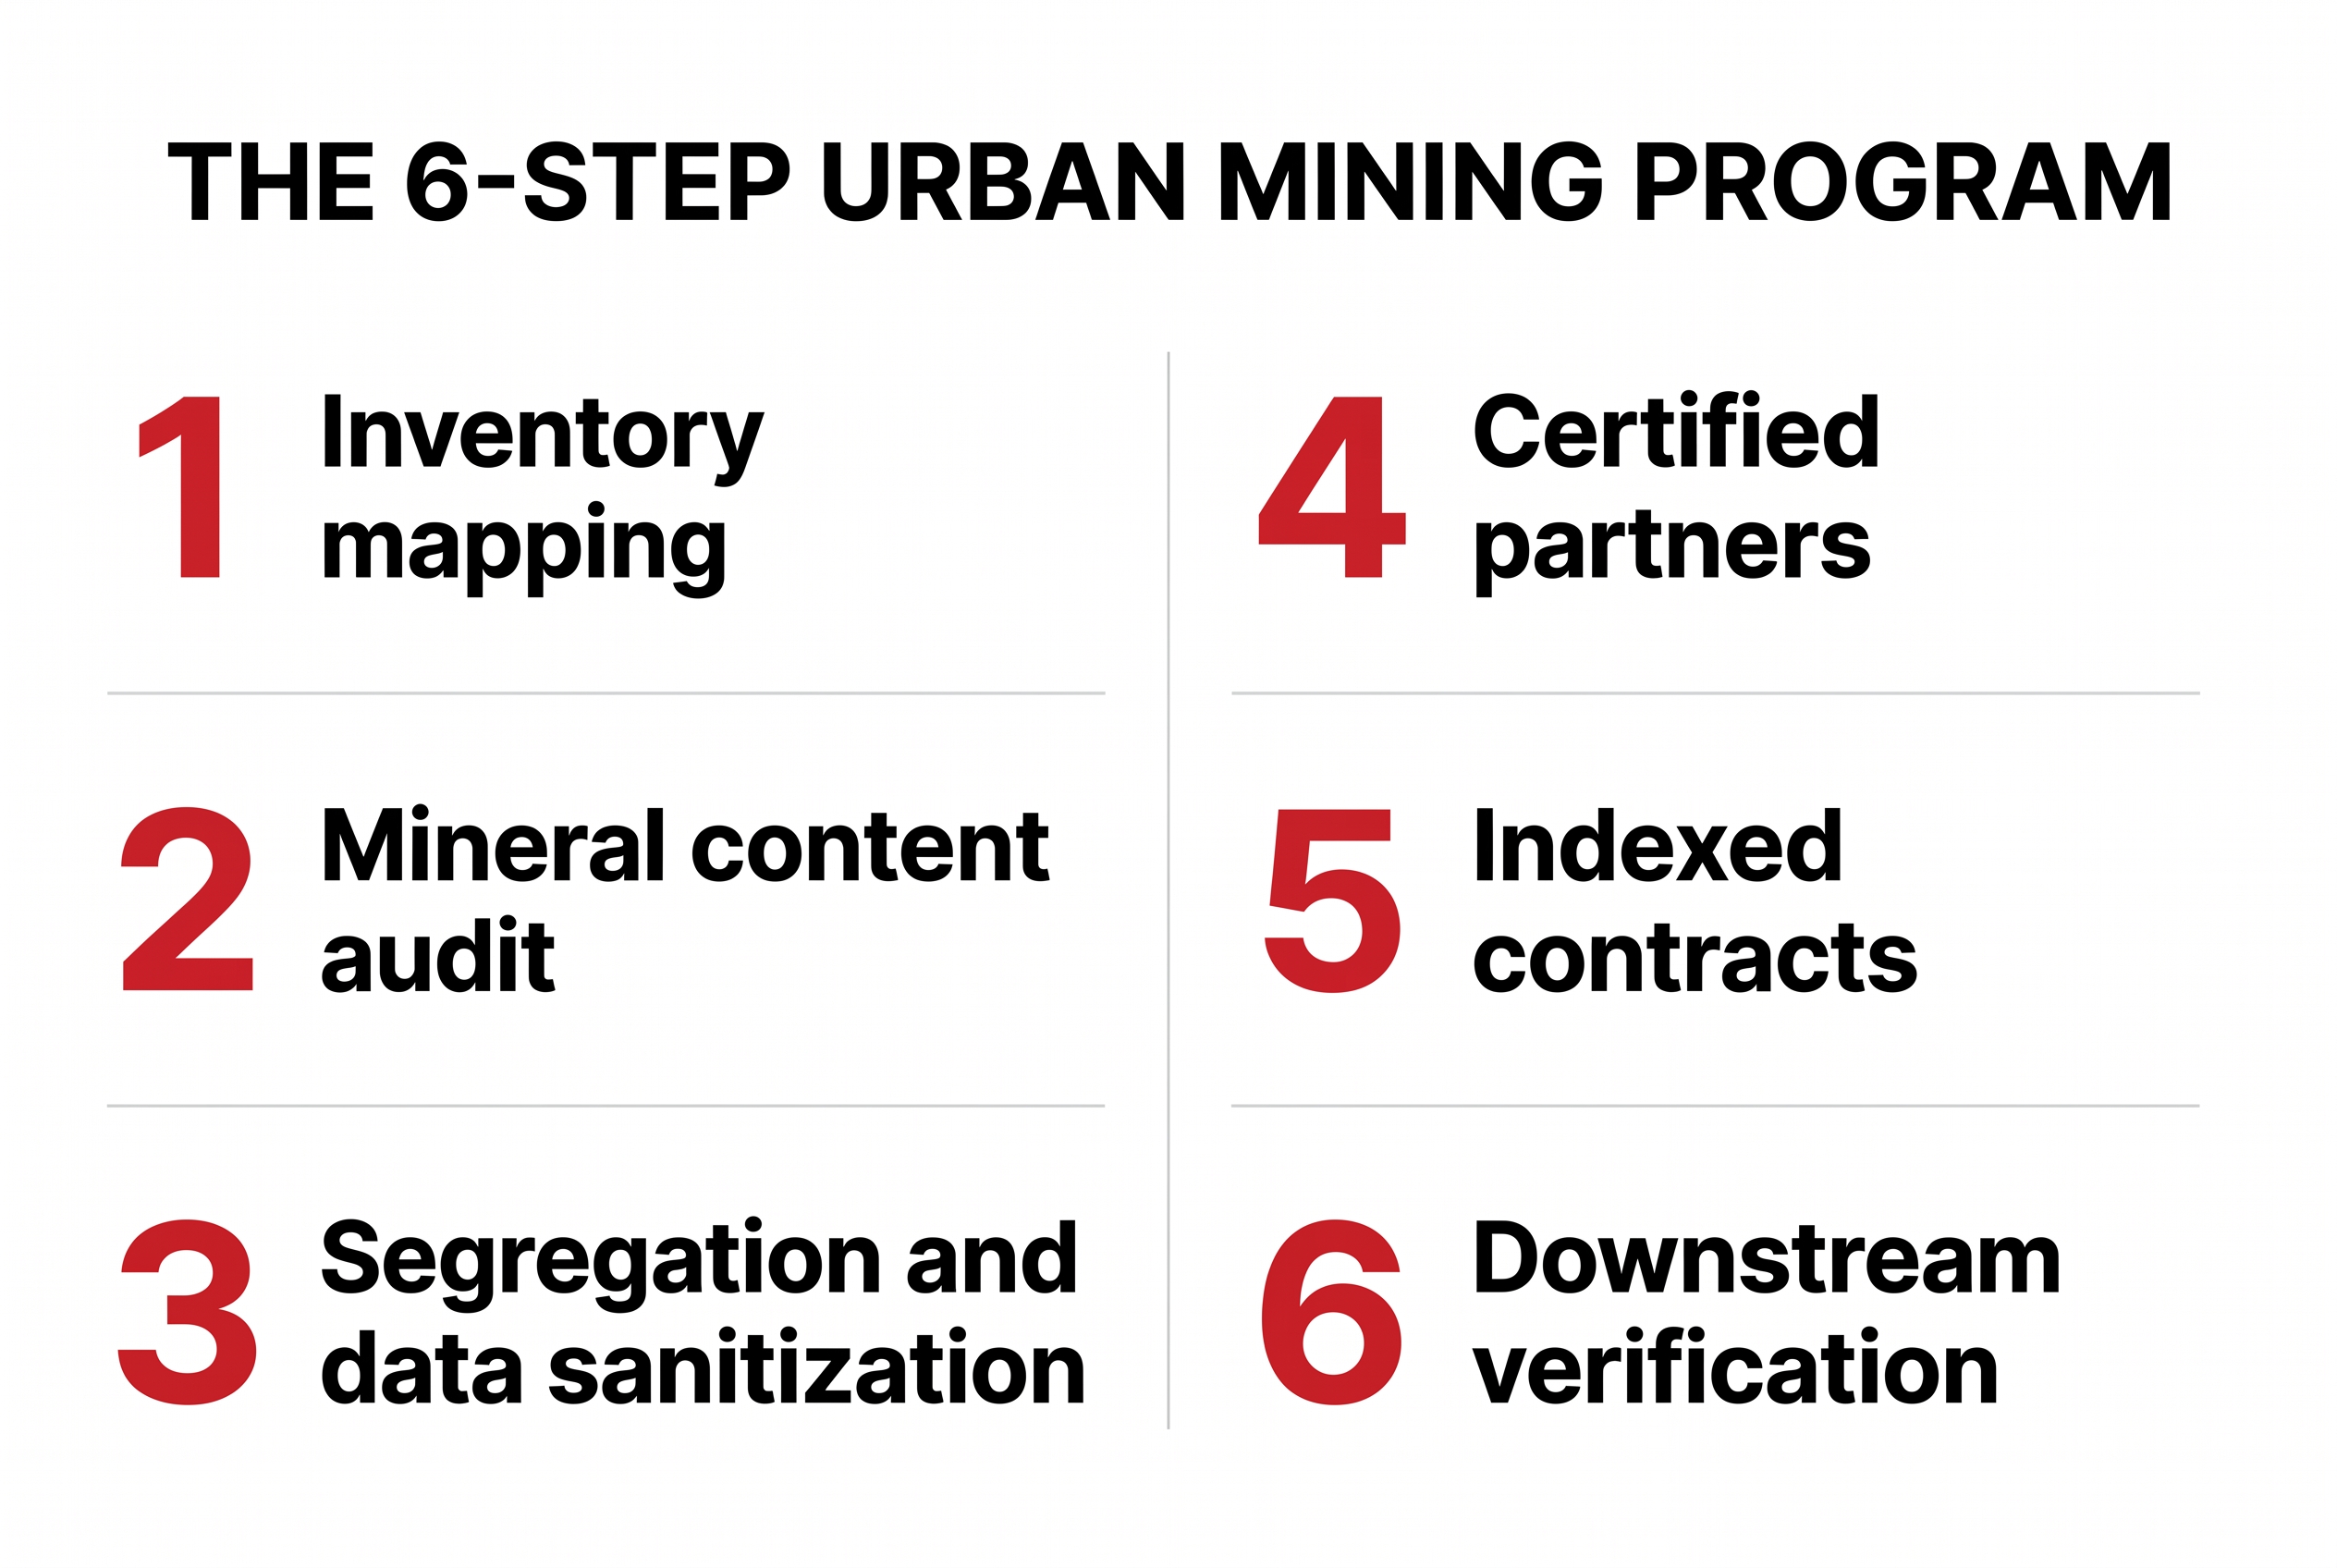
The six-step urban mining program: from inventory mapping to downstream verification.
Step 1 and 2: Inventory mapping and mineral content audit
Start by tagging your surplus register with material categories. You do not need a lab; published bills of materials, manufacturer data, and recycler assay libraries get you to a defensible estimate. Flag the five high-value classes from the table above, then rank by both estimated mineral value and volume predictability. A steady quarterly stream of retired servers is worth more to a downstream buyer than a one-time windfall, because processors plan capacity around committed feedstock. If your organization lacks a formal surplus register, begin with our guide to maximizing returns from end-of-life equipment.
Step 3 and 4: Segregation, data sanitization, and certified partners
Value concentrates when streams stay separated. Mixed loads price at the lowest common denominator; segregated magnet-bearing drives, clean copper, and sorted boards each price at their own grade. For anything data-bearing, sanitization comes first, full stop. NIST 800-88 compliant erasure or destruction, serialized and certified, protects the enterprise and preserves resale optionality. Then select processing partners holding R2v3 or e-Stewards certification for electronics and relevant ISO standards for metals. Our complete ITAD guide covers vendor diligence in detail, and our review of e-waste and ITAD trends explains how certification expectations are tightening.
Step 5 and 6: Contract structures and downstream verification
Move from gate-fee thinking to revenue-share thinking. The strongest 2026 contract structures include indexed pricing tied to published metal benchmarks, assay transparency with the right to witness or audit sampling, and chain-of-custody reporting that follows material to final processing. That last element is what converts a disposal transaction into a documented critical mineral stream you can cite in sustainability disclosures. Require mass-balance certificates and downstream processor identification in every materials recovery agreement.
Valuation: What Critical Mineral Streams Are Worth in 2026
Pricing benchmarks by material stream
Commodity-linked streams move daily, but the 2026 structure looks like this: copper trades at historic highs on AI data center and grid demand, with analysts at major banks projecting structural deficits into the 2030s. Gold-bearing boards price off assay against a gold market that has stayed elevated. NdPr pricing in the US now has a de facto floor via the DOD arrangement, giving magnet scrap unusual price stability. PGM catalyst streams remain refiner-competitive. The discipline is to price your streams against published benchmarks rather than accepting flat per-pound quotes that hide the metal value.
Copper at record highs: timing the market
Data centers alone are projected to nearly double their copper consumption to around 1.3 million tonnes per year by 2030, and a single 1 gigawatt AI campus can absorb up to 50,000 tonnes during construction. Grid expansion to power those campuses adds more demand on top, a dynamic we explored in our piece on emerging trends in electric transformers. For holders of copper-dense surplus such as transformers, switchgear, motors, and cabling, 2026 is a seller’s market. The practical move is to accelerate disposition of copper-heavy inventory that has no redeployment path while prices sit above historical trend.
When to hold, when to sell: capital spares vs commodity streams
Not everything should be mined. Working equipment with redeployment potential, long-lead capital spares, and semiconductors with functional resale markets often carry far more value intact than shredded. The used semiconductor equipment market is a standing reminder that a functioning tool can be worth orders of magnitude more than its constituent elements. Run the comparison explicitly: resale value net of remarketing cost versus material value net of processing cost. Urban mining is the floor under your asset value, never the ceiling.
Sustainability win: The IEA finds that recycled energy transition minerals such as nickel, cobalt, and lithium carry roughly 80% lower greenhouse gas emissions than the same minerals produced from primary mining. Every tonne your program recovers is a quantifiable emissions avoidance.
Urban Mining, ESG Reporting, and the Circular Economy Case
Scope 3 and embodied carbon benefits of secondary supply
Secondary materials displace primary extraction, and the emissions delta is large and citable. Feeding recovered minerals back into supply chains reduces categories 1, 2, and 12 exposure in your value chain accounting. If your sustainability team is building out value chain disclosures, connect your urban mining metrics to the framework in our Scope 3 emissions reduction playbook. Recovered tonnage, verified downstream processing, and avoided-emissions math translate directly into disclosure-grade data.
Reporting recovered minerals in sustainability disclosures
The reporting pattern that works: state the mass recovered by material category, name the certification standard of the processors, apply a recognized emissions factor for primary versus secondary production, and disclose the methodology. Auditors accept documented mass balance far more readily than estimated diversion percentages. This is also where urban mining strengthens zero waste commitments; material recovery at the elemental level is the deepest form of landfill diversion, complementing the approaches in our zero waste landfill diversion guide.
Positioning IR as a strategic supply chain function
The deeper opportunity is organizational. When recovered magnets feed a defense-backed domestic supply chain and recovered copper feeds the grid buildout, the investment recovery function stops being a cost center that empties warehouses and becomes a supply chain node that delivers strategic materials. That reframing changes budget conversations, headcount conversations, and executive visibility. IR professionals who can speak the language of critical minerals, recycled content mandates, and verified chain of custody will find themselves in rooms they were not invited to in 2020.
Frequently Asked Questions
Sources and References
- ITU and UNITAR, The Global E-waste Monitor 2024: 62M tonnes generated, 91 billion dollars embedded metal value, 22.3% formal recycling rate.
- IEA, Recycling of Critical Minerals (2024): recycling reduces new mining needs 5 to 30% by 2040; 80% lower GHG for secondary minerals; 200 billion dollar recycled minerals market by 2050.
- European Commission, European Critical Raw Materials Act: 2030 benchmarks of 10% extraction, 40% processing, 25% recycling.
- MP Materials, DOD public-private partnership announcement (2025): 1.25 billion dollar 10X campus, 110 dollar per kg NdPr price floor, Apple 500 million dollar recycling investment.
- Resource Recycling, MP Materials breaks ground on rare earth magnet campus (February 2026).
- IEA, Global Critical Minerals Outlook 2025: secondary supply shares by 2040 for cobalt, nickel, lithium, and copper.
- S&P Global, Copper in the Age of AI: data center and electrification copper demand analysis.
- World Economic Forum, What is urban mining and why do we need to do more of it?: definitional framing and e-waste ore-grade comparisons.
This article is published by the Investment Recovery Association (IRA) for educational and informational purposes only. It does not constitute legal, financial, or professional advice. Market data, statistics, and projections cited are sourced from third-party reports and are subject to change. Readers should consult qualified professionals before making business decisions based on the information presented. The IRA makes no warranties regarding the accuracy or completeness of third-party data referenced herein.