TL;DR
- Scope 3 emissions account for 70 to 90 percent of a typical company’s carbon footprint, and CDP data shows supply chain emissions are 26 times larger than direct operations.
- CSRD, California SB 253, and the SEC climate rule all converge in 2026, making Scope 3 disclosure no longer optional for any large company doing business across borders.
- Investment recovery directly reduces four Scope 3 categories: purchased goods (1), capital goods (2), use of sold products (11), and end-of-life treatment (12), which together drive the majority of value-chain emissions.
- Every redeployed asset is an avoided emission, and that math now belongs in your sustainability report alongside your financial recovery numbers.
- IR professionals are the operational backbone of any credible decarbonization strategy, because surplus is where ESG meets the P&L.
Why Scope 3 Emissions Are 2026’s Biggest ESG Reporting Challenge
For most large enterprises, scope 3 emissions are no longer a future problem. They are the 2026 problem. According to CDP, Scope 3 supply chain emissions are on average 26 times greater than a company’s own Scope 1 and 2 emissions combined, and the GHG Protocol’s analysis puts Scope 3 at roughly 75 percent of a typical company’s total footprint, with sector estimates running as high as 90 percent for capital-intensive industries. That is the entire upstream and downstream value chain compressed into a single reporting line, and regulators are now forcing it into the open.
Three rule sets converged this year. The EU Corporate Sustainability Reporting Directive (CSRD), as revised by the Omnibus I package, still applies to roughly 11,000 companies with more than 1,000 employees and €450 million in turnover. The European Sustainability Reporting Standards (ESRS E1) require those companies to disclose material Scope 3 categories with limited assurance, and the simplified ESRS package being adopted in 2026 explicitly preserved the Scope 3 GHG disclosure requirements. California’s SB 253 begins requiring Scope 1 and 2 disclosure by August 10, 2026, with full Scope 3 reporting starting in 2027 for any company with more than $1 billion in revenue doing business in the state. And while the federal SEC climate rule remains stayed, most Fortune 500 companies are already preparing as if it will return in some form.
That regulatory triangulation has changed which department gets the call when sustainability data is missing. As we covered in our analysis of green asset management ROI, the CFO and the Chief Sustainability Officer now share the same spreadsheet. And the row that has been quietly missing from both? The one labeled “what happened to the equipment we retired this year.”
Average share of a company’s total carbon footprint attributable to Scope 3 emissions (GHG Protocol & WRI)
The 70 Percent Problem That Made Surplus Strategic
For decades, surplus equipment lived in the operational shadows. A pallet of decommissioned servers, a retired CNC machine, an idled chiller, a warehouse of MRO spare parts left over from a plant closure. Nobody outside facilities or supply chain noticed. That has changed because every one of those items is now a Scope 3 line item, and the way you dispose of them determines whether the carbon embedded in their manufacture is recovered or written off.
The shift is most visible in three financial behaviors. CFOs are pulling forward asset disposition decisions because tariff economics have boosted secondary market value, a dynamic we mapped in detail in our analysis of how 2026 tariffs are reshaping surplus asset management. Procurement teams are demanding embodied carbon data from suppliers, because their own buyers are now asking the same questions. And boards are approving budget for asset management systems that can produce auditable disposition records, because limited assurance under CSRD means an external reviewer is going to ask where the assets went.
Mapping Investment Recovery to the 15 Scope 3 Emissions Categories
The GHG Protocol divides Scope 3 into 15 categories across upstream and downstream activities. Most companies do not have material exposure in all 15. But investment recovery touches four of the heaviest, and these are the ones where surplus asset programs produce the most defensible reduction numbers.
| Scope 3 Category | How Investment Recovery Reduces It | Typical Materiality |
|---|---|---|
| Category 1: Purchased goods and services | Redeploying surplus internally avoids purchasing new goods, eliminating the embodied carbon of replacement units. | Often the single largest Scope 3 category for manufacturers and retailers. |
| Category 2: Capital goods | Extending the useful life of capital equipment via refurbishment or resale shifts the embodied carbon over more productive years. | Critical for capital-intensive sectors (utilities, telecom, manufacturing). |
| Category 11: Use of sold products | Refurbishing and reselling products you originally sold extends their use phase and avoids replacement-cycle emissions. | Can exceed 90 percent of footprint for capital goods makers. |
| Category 12: End-of-life treatment | Diverting from landfill into reuse, remanufacturing, or material recycling cuts disposal emissions and EPR liability. | Increasingly material under Extended Producer Responsibility regimes. |
Category 1: Purchased Goods and Services
Every time an organization redeploys a surplus asset instead of buying a new one, it eliminates the entire upstream emissions footprint of a replacement unit. The GHG Protocol calls this an avoided emission, and while you do not subtract it from your gross Scope 3 number, you absolutely report it as an avoided-emissions disclosure. For diversified manufacturers, purchased goods can easily account for 40 to 60 percent of total Scope 3 emissions, which means a high-functioning internal redeployment program is one of the few decarbonization levers with both an ROI and a measurable carbon abatement curve.
Category 2: Capital Goods (Where Embodied Carbon Lives)
Category 2 covers the cradle-to-gate emissions of capital goods purchased in the reporting year. The challenge with capital equipment is that the embodied carbon is enormous and front-loaded. A new server, a new chiller, a new piece of production tooling carries years of accumulated manufacturing emissions baked into its first day of operation. The way to dilute that carbon intensity per year of service is to extend the asset’s useful life, which is exactly what a mature investment recovery program does through refurbishment, parts harvesting, and qualified resale into secondary markets. The same logic governs battery energy storage second-life applications and wind turbine blade recycling: the embodied carbon was paid for; the question is how many useful years you extract before it gets written off.
Category 11: Use of Sold Products
This category is the one OEMs and asset-intensive sellers cannot escape. The emissions from a customer using your product for ten years dwarf almost everything else. Refurbishment programs, buyback programs, and authorized resale partnerships let you intervene mid-life on products you originally sold. They also generate the most credible Scope 3 reduction stories, because you have first-party data on the refurbishment and the resale path.
Category 12: End-of-Life Treatment
End-of-life treatment, defined as Scope 3 Category 12, captures emissions from waste processing, landfill operations, incineration, and recycling of sold products at end of life. This is where the recovery hierarchy matters most. Landfill is the worst outcome on every axis (carbon, EPR liability, reputational). Material recycling is better. Refurbishment and reuse are dramatically better. As an illustrative benchmark, reused steel embodies approximately 97.5 percent less carbon than newly produced steel. The same logic applies, with smaller multipliers, to almost every category of industrial equipment, which is the entire premise of circular economy asset management.
The IR sustainability dividend: Every avoided purchase, every extended useful life, and every diverted disposal is a quantifiable Scope 3 reduction that lives in the same data system your finance team already uses to track recovery dollars.
The Carbon Math: How Surplus Asset Programs Generate Avoided Emissions
Calculating avoided emissions from investment recovery follows a straightforward three-step pattern: identify the displaced new purchase, calculate its embodied carbon, then claim the reduction with proper boundary accounting. The math is not the hard part. The hard part is the data infrastructure to do it consistently across thousands of transactions and have it survive limited assurance.
Embodied Carbon Recovery: The Hidden ESG Win
Embodied carbon refers to the GHG emissions from material extraction, transport, and manufacturing of a product. For a typical industrial asset, the embodied carbon is paid once at the point of manufacture and then amortized across the asset’s useful life. Three actions concentrate the avoided emissions: repurposing existing assets or materials, choosing lower-emission replacements when new purchases are required, and qualifying refurbished or remanufactured units into the procurement-approved supplier list.
What changes in 2026 is that the avoided emissions are now reportable. The GHG Protocol distinguishes inventory emissions (what you report in your inventory) from project-based reductions (what you can claim as avoided), and most assurance providers now accept well-documented avoided emissions disclosures alongside the inventory.
Calculating Avoided Emissions From Redeployment
The formula is straightforward:
Avoided Emissions = (Embodied carbon per unit of replacement asset) × (Number of units displaced) − (Refurbishment, transport, and remarketing emissions of the redeployed unit)
The net result is almost always positive by a wide margin, because the embodied carbon of new manufacture dominates the relatively small operational emissions of refurbishment. For a CSRD-aligned program, you also document the system boundary, the assumed replacement product, the emission factor source, and the data quality tier per the GHG Protocol’s data hierarchy.
Auditable Data Your Auditor Will Accept
Limited assurance is not a paperwork exercise. The auditor will ask: where did the asset go, who took title, what was the substantiated replacement counterfactual, and which emission factor library did you use. The investment recovery teams that pass this gate are the ones that have already built chain-of-custody discipline for resale, recycling, and refurbishment paths. That is the same discipline we covered in our guides to data center decommissioning and aircraft retirement and parts recovery, just now extended one column to the right for emissions.
Building a CSRD-Ready Investment Recovery Program for Scope 3 Emissions in 2026
If your organization is in scope for CSRD, California SB 253, or any voluntary Scope 3 commitment under SBTi, the practical question is: what does an audit-ready investment recovery program look like? Four steps, in order.
Step 1: Inventory the Surplus That Is Already There
Every Scope 3 reduction story starts with a baseline. Most organizations have no current view of how much surplus equipment, MRO inventory, IT hardware, and capital goods are sitting idle across their sites. A simple 90-day inventory sprint, run jointly by IR and facilities, almost always uncovers double-digit millions in recoverable value. We walked through this end to end in how to start an investment recovery program at your organization, and the inventory step is where the carbon baseline gets built too.
Step 2: Establish a Recovery Hierarchy
The hierarchy, in priority order: redeploy internally, refurbish for resale, sell as functional surplus, harvest parts, recycle material, and finally dispose. Each step up the hierarchy multiplies both the financial recovery and the avoided emissions. This is the operational heart of circular asset management, and it is the one place where the sustainability narrative and the recovery dollars are perfectly aligned.
Step 3: Chain-of-Custody Documentation
For each disposition, record: asset identifier, age, condition grade, disposition path, recipient (with documentation), date, and where applicable, recycling certificate. This is the same documentation discipline that ESG-compliant asset lifecycle management demands, and the same discipline that CMIR-certified professionals already practice.
Step 4: Integrate IR Data Into ESG Reports
The final mile is plumbing. Your investment recovery transactions need to flow into your carbon accounting platform, and the avoided emissions need to be reported alongside the recovered dollars. The cleanest model: IR owns the operational data, sustainability owns the disclosure, finance owns the assurance liaison, and the three meet quarterly to reconcile.
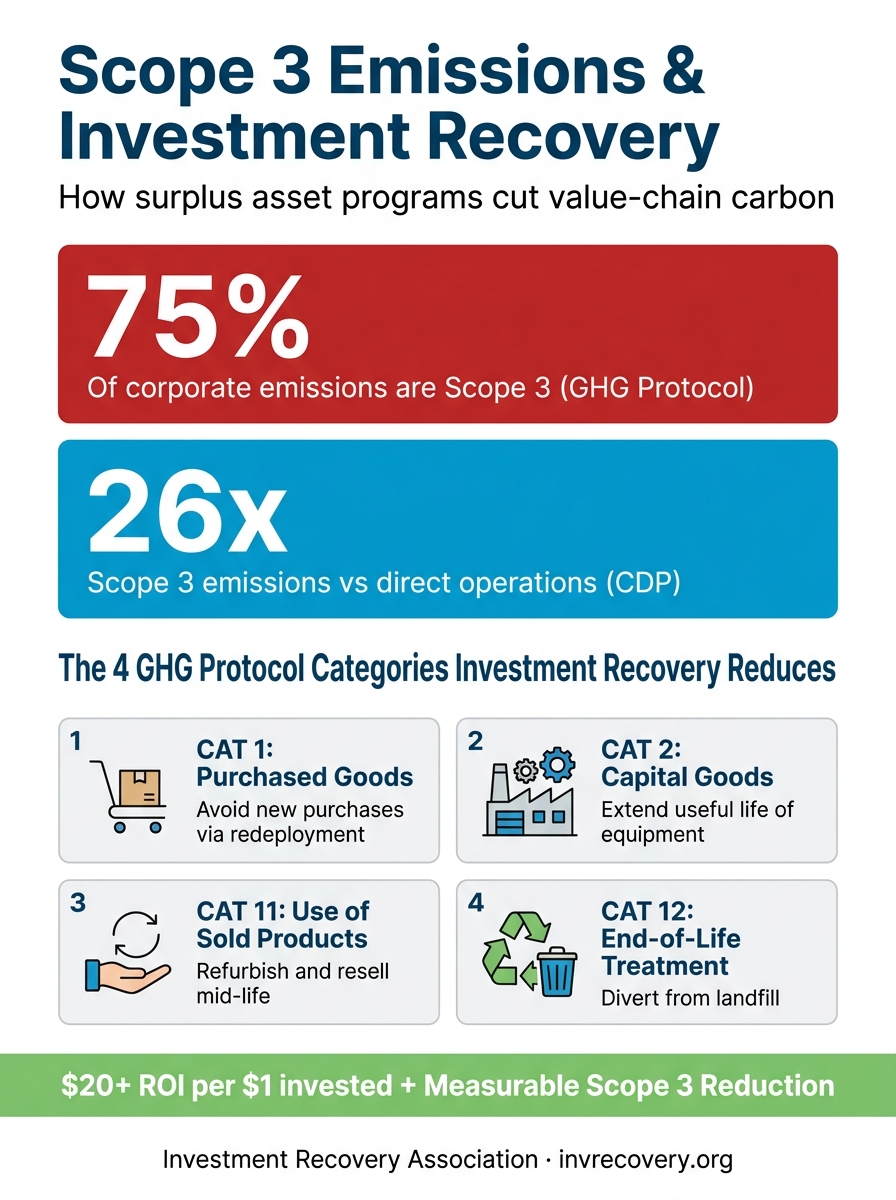
Investment recovery directly reduces four of the 15 GHG Protocol Scope 3 categories, with the largest impact in purchased goods, capital goods, use of sold products, and end-of-life treatment.
Common Pitfalls (and How to Avoid Them)
Three failure modes show up repeatedly in early Scope 3 disclosures that lean on investment recovery data. Each has a clean fix.
Double-Counting Across Scopes
If you operate the facility that refurbishes your own surplus, the energy used in refurbishment is your Scope 1 or 2 emission, not a Scope 3 line. Define the boundary explicitly so the same kilowatt-hour does not get counted twice.
Greenwashing Risk in “Reuse” Claims
An asset is only reused if it is reused. If you transfer it to a buyer who then scraps it, that is recycling at best and landfill at worst. The chain-of-custody requirement exists precisely so the disposition path is documented end to end. Limited assurance auditors are specifically watching for this.
Misunderstanding Extended Producer Responsibility
Extended Producer Responsibility (EPR) is the largest related search topic in this ecosystem, with global volume above 12,000 monthly searches. EPR rules increasingly assign end-of-life liability to the original producer, not the user, which is changing how OEMs design buyback and take-back programs. If you are an OEM, your investment recovery function is the operational arm of your EPR strategy. Build the program assuming the producer carries the end-of-life obligation, because in more and more jurisdictions, they do.
The Business Case: Why CFOs Now Champion Investment Recovery
For 50 years, the Investment Recovery Association has documented that high-functioning IR programs return more than $20 for every $1 invested. That number has not changed. What has changed is that the same program now also delivers a measurable ESG dividend that maps directly to the disclosures the CFO has to sign off on. That is a rare alignment.
Three trends push CFO interest higher in 2026. The first is that tariff-driven secondary market demand has raised resale values for used industrial equipment, expanding the financial recovery side of the equation. The second is that limited assurance under CSRD has made disposition records a controlled-document category, which means the systems IR teams have been quietly maintaining are suddenly material to the audit. The third is that institutional investors and customers are asking for value-chain emissions data, and a company with a documented investment recovery program has an answer the company without one does not.
For the IR profession, the takeaway is structural. Investment recovery used to be a tactical function. It is becoming a governed value-stewardship function. The same trajectory documented in our 2026 investment recovery trends analysis, just amplified by climate disclosure.
Documented financial return from mature investment recovery programs, now paired with a measurable Scope 3 reduction.
What Investment Recovery Professionals Should Do This Quarter
If you are an IR professional reading this in mid-2026, three near-term moves position you for the next disclosure cycle. First, get in the room with your sustainability lead and your controller and offer a single page on how your function’s data feeds Scope 3 categories 1, 2, 11, and 12. Most sustainability teams do not yet know IR data exists. Second, audit your chain-of-custody documentation for the past 12 months and identify the gaps your auditor will find. Fix those before they do. Third, ask your asset management or ERP platform whether it can tag disposition transactions with the carbon factors your sustainability team uses; if it cannot, make the case to add a field.
For organizations starting from scratch, the playbook is mature. Start with the inventory, build the hierarchy, document the custody, and feed the data into your ESG report. The financial return funds the program. The Scope 3 reduction makes it strategic.
Frequently Asked Questions
Sources and References
- GHG Protocol, “Corporate Value Chain (Scope 3) Accounting and Reporting Standard” — Authoritative definition of the 15 Scope 3 categories.
- CDP (2024) — Source for the 26x supply chain vs. operational emissions multiplier.
- Anthesis Group, “CSRD Scope 3 Reporting Requirements (2026)” — Post-Omnibus CSRD scope and Scope 3 obligations.
- ISS Corporate, “CARB Updates on California SB 253 (April 2026)” — California reporting timeline for 2026 and 2027.
- Plan A, “End-of-life treatment of sold products (Scope 3 Category 12)” — Definitional guidance for Category 12.
- McKinsey, “Reducing embodied carbon in new construction” — Reuse and embodied carbon multipliers (e.g., reused steel at ~97.5% less embodied carbon).
- PwC, “Scope 3 emissions: what you really need to know” — Practitioner overview of Scope 3 disclosure obligations.
- GHG Protocol, “Technical Guidance for Calculating Scope 3 Emissions” — Calculation methodologies and data hierarchy.
This article is published by the Investment Recovery Association (IRA) for educational and informational purposes only. It does not constitute legal, financial, or professional advice. Market data, statistics, and projections cited are sourced from third-party reports and are subject to change. Readers should consult qualified professionals before making business decisions based on the information presented. The IRA makes no warranties regarding the accuracy or completeness of third-party data referenced herein.